Every systematic trader is constantly on the lookout for recurring market patterns that can be exploited with a rules-based approach. Among the many questions that arise, one stands out: Is buying the two most important stock indices in the world, the Nasdaq and the S&P 500, after a sharp drop actually a sound strategy?
We know that, over the medium to long term, both indices have consistently trended upward. However, it’s equally true that they’ve also experienced significant drawdowns at various points in history, followed by eventual recoveries. Think back to the 2008 financial crisis, the COVID-19 pandemic in 2020, or the 2022 stock market decline following the invasion of Ukraine. In all of these cases, holding these indices in a portfolio would have resulted in substantial losses, often in a very short period of time.
So, here’s the real question: Would waiting for a major pullback before investing have led to smaller losses, and potentially higher returns?
Initial Analysis: The Classic Buy & Hold Strategy
Let’s begin by turning these ideas into rules so we can test their effectiveness using historical data and assess whether, at least in the past, this approach has actually worked. For our analysis, we’ll use historical data from the Nasdaq futures (@NQ) and S&P 500 futures (@ES), covering the period from 2008 to today.
As a first step, we’ll look at what would have happened if we had invested in these instruments using a basic Buy & Hold strategy. To simulate this, we assume entering a long position at the market open and holding it for 10 consecutive trading sessions, repeating this process continuously. This setup allows us to directly compare this baseline system, which closely resembles a traditional Buy & Hold, with the alternative strategies we’ll introduce later, all of which also maintain a fixed 10-session trade duration.
Strategy #1
input: n_bars(10);

if sessionlastbar then buy next bar market;

if barssinceentry > n_bars then setexitonclose;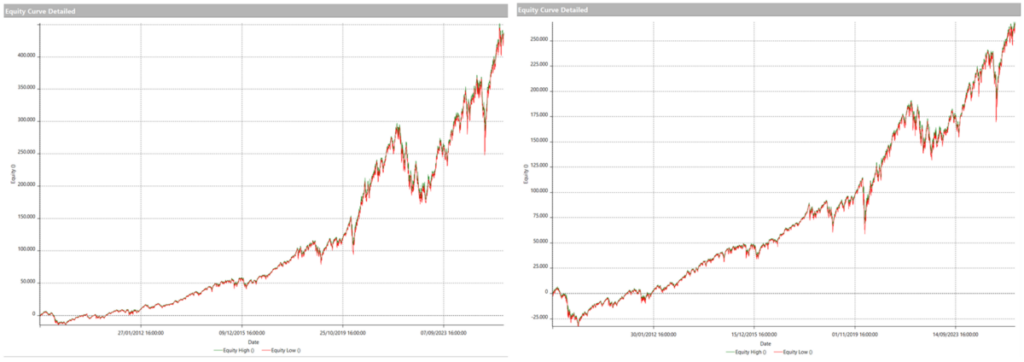
Figure 1 – Equity lines for the baseline Buy & Hold strategy. Left: Nasdaq futures (@NQ), right: S&P 500 futures (@ES).
| Net Profit | Avg Trade | Nr. Trades | Max Drawdown | |
| @ES | $258,500.00 | $676.70 | 382 | -$71,687.50 |
| @NQ | $439,725.00 | $1,151.11 | 382 | -$125,765.00 |
As we can see, in markets that have grown significantly over the past decades, simply holding the position would have led to substantial profits. However, this comes at the cost of enduring major drawdowns during bear market phases.
Strategy With a 3-Day Pullback Filter
Next, let’s introduce a condition for entering the market: the daily closing price must have been lower than the previous day’s for three consecutive sessions. Once in the market, we’ll exit after 10 sessions, just like in the previous strategy.
Strategy #2
input: n_bars(10);

if close < close[1] and close[1] < close[2] and close[2]  n_bars then setexitonclose;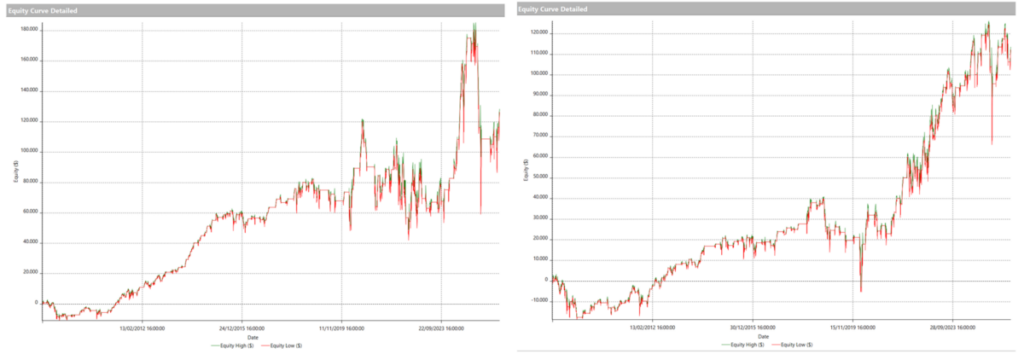
Figure 2 – Equity lines for the strategy using a 3-day pullback entry condition. Left: Nasdaq futures (@NQ), right: S&P 500 futures (@ES).
| Net Profit | Avg Trade | Nr. Trades | Max Drawdown | |
| @ES | $106,337.50 | $677.31 | 157 | -$60,037.50 |
| @NQ | $116,415.00 | $705.55 | 165 | -$126,235.00 |
Looking at both the equity curves and performance metrics, it’s clear that this filter didn’t improve the strategy’s behavior. In fact, the equity lines appear even more erratic than before, and key metrics show a decline, particularly the Net Profit across both markets and the average trade value on the Nasdaq. While the maximum drawdown improved slightly on the S&P 500, the overall results are unconvincing.
Strategy With a Deeper Pullback and Moving Average Filter
Let’s now try to refine the entry conditions. Instead of requiring a decline over the last three consecutive sessions, we’ll reduce it to two, adding an extra filter: the most recent close must be below the 10-day moving average (roughly two trading weeks). The idea is to open a position only when the market has experienced a more significant pullback, thus making entries more selective.
Strategy #3
input: n_bars(10);

if close < close[1] and close[1] < close[2] and close  n_bars then setexitonclose;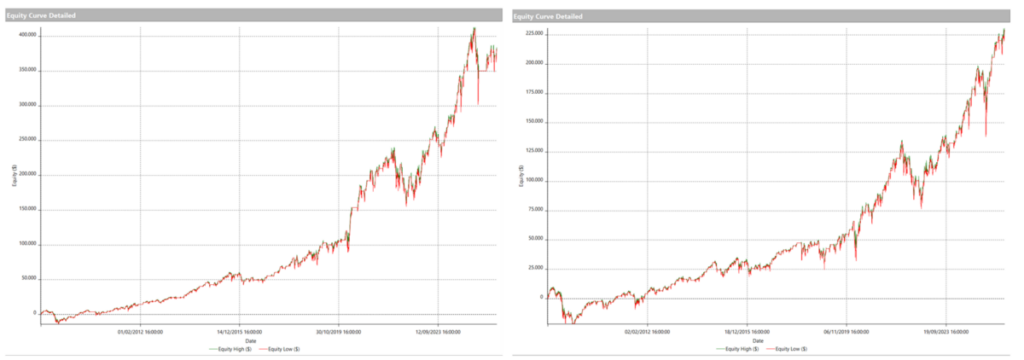
Figure 3 – Equity lines for the strategy using more selective entry conditions. Left: Nasdaq futures (@NQ), right: S&P 500 Futures (@ES).
| Net Profit | Avg Trade | Nr. Trades | Max Drawdown | |
| @ES | $229,850.00 | $1,021.56 | 225 | -$60,575.00 |
| @NQ | $372,205.00 | $1,715.23 | 217 | -$111,400.00 |
At this point, the results start to look promising. Not only did we retain a significant portion of the original net profit, but we also managed to reduce the maximum drawdown and, most notably, we saw a roughly 50% increase in the average trade value on both instruments.
Momentum Filter Strategy: Entering Only When the Market Shows Signs of Recovery
There’s one final test to run. Up until now, we’ve focused on identifying optimal pullback conditions. But there’s another crucial component to strategies that buy on dips: accurately pinpointing when the market is beginning to recover.
To do this, we modified our script to include an additional entry condition based on momentum. In essence, no long positions will be taken until prices begin to show signs of upward movement. After optimizing the lookback period for the momentum indicator, we chose a setting of 8, among several strong alternatives, another confirmation of the filter’s effectiveness. The rule is simple: the 8-day momentum must be greater than zero, signaling an active market rebound.
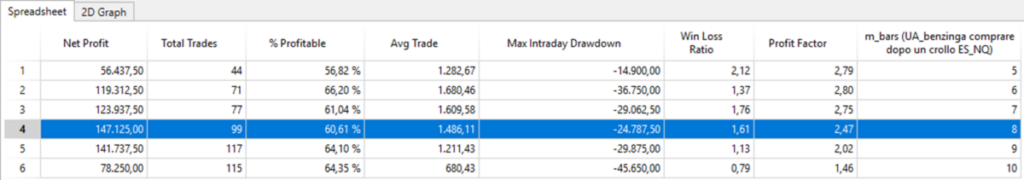
Figure 4 – Results from the momentum indicator optimization process.
Strategy #4
input: n_bars(10),m_bars(8);

if close < close[1] and close[1] < close[2] and close  0 then buy next bar market;

if barssinceentry > n_bars then setexitonclose;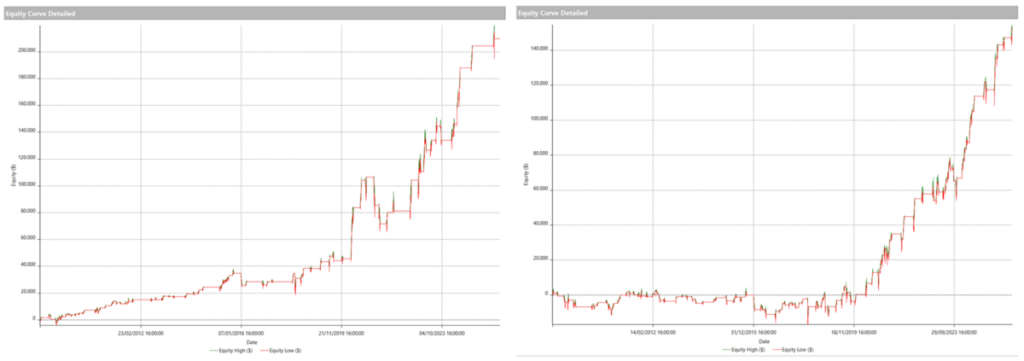
Figure 5 – Equity lines for the momentum-filtered strategy. Left: Nasdaq futures (@NQ), right: S&P 500 futures (@ES)
| Net Profit | Avg Trade | Nr. Trades | Max Drawdown | |
| @ES | $153,612.50 | $1,536.13 | 100 | – $24,787.50 |
| @NQ | $209,760.00 | $2,589.63 | 81 | -$41,325.00 |
The table and equity curves confirm what we saw during the optimization phase. While total profits decreased, as expected due to fewer trades, the average trade value more than doubled compared to earlier strategies. Most importantly, the maximum drawdown was reduced to a third of the original value, resulting in a far smoother and more stable equity curve.
Conclusions of the Analysis
Based on the tests we conducted, we’ve seen that looking for “market bottoms” as entry points in the world’s most important equity markets (S&P 500 and Nasdaq) is indeed an interesting approach, provided there is a well-defined risk management system in place.
That’s precisely what’s missing in the strategies presented in this article, effectively making them too risky for live trading. However, the goal was something else entirely: to determine whether waiting for a significant market decline in indices that tend to rise most of the time could provide a more favorable opportunity to go long.
The answer, as we’ve seen, is yes. That said, this approach hasn’t always delivered satisfactory results, and developing a truly effective strategy has proven to be complex. In fact, identifying and quantifying a market crash remains one of the most difficult challenges for any systematic trader.
Until next time, happy trading!
Benzinga Disclaimer: This article is from an unpaid external contributor. It does not represent Benzinga’s reporting and has not been edited for content or accuracy.