Undeniably, artificial intelligence has been the dominant force in the broader business ecosystem. However, the sector hasn’t elevated every adjacent enterprise, with Dell Technologies Inc (NYSE:DELL) representing a clear negative outlier. Historically associated with retail-facing PCs, Dell has steadily pivoted toward AI infrastructure: machine-intelligence-optimized servers, storage and networking solutions. Unfortunately for DELL stock, this arena isn’t exactly seen as particularly enticing.
At the core, Dell Technologies is a beneficiary of capex reality rather than AI hype. Fundamentally, we know that AI doesn’t run on slogans and grandiose visions of an extraordinary future — often delivered by head executives of pure-play chip designers. Instead, machine learning is only possible through hardware that has to be sourced, assembled, deployed, cooled and maintained.
That’s the area where Dell sits. The problem is investors often view this segment of the AI value chain as unenticing and commoditized.
It’s not just a rhetorical concern either. Since the start of the year, DELL stock has only gained a little over 7%. That pales in comparison to the vanilla S&P 500 index, which has gained more than 15%. Further, technical analysts will likely argue that DELL may be printing what is known as a head-and-shoulders formation that began around early August.

To be fair, the “magic” really isn’t in the pattern itself but what it symbolizes, which is failed demand. Essentially, market technicians may assert that each successive push to higher ground leads to fewer marginal buyers. Eventually, sellers overwhelm buyers after the third push (second shoulder), leading to a downturn.
While it could be true, I’m going to disagree — mostly because the pullbacks have been orderly. We’re not seeing the rapid-fire reactions and expanding volatility that would underscore the implications of the technical pattern.
Instead, traders have been steadily digesting negative price discovery, which reveals more thoughtful behavior.
Shifting Frameworks To Reveal The Risk Geometry Of DELL Stock
One of the other major concerns about the technical assertion is that the head-and-shoulders pattern represents a one-off event. As far as I can tell, this is the only time that DELL has flashed the signal on such a large scale. Therefore, we are hinging the probability of the pattern holding true to its implications based on what we have observed in other stocks.
I propose a more reliable mechanism is to study how the same signal has impacted DELL stock itself — not how it affected other securities and transposing the results onto DELL.
To achieve such analysis requires a radical reshaping of frameworks. First, price action needs to be discretized and categorized. Second, this price action needs to be iterated in multiple rolling trials or sequences in a fixed-time distribution.
For example, if we took a single 10-week cycle of DELL stock, the return during this period won’t tell us much about the performance probability of the other weeks in the dataset. However, if we stacked hundreds of 10-week returns in a distribution, the most frequent performance metrics will create a bulge in probability density.
This bulge would be the risk geometry. It signifies where probabilistic mass gets larger — and more importantly, where it begins to fade.
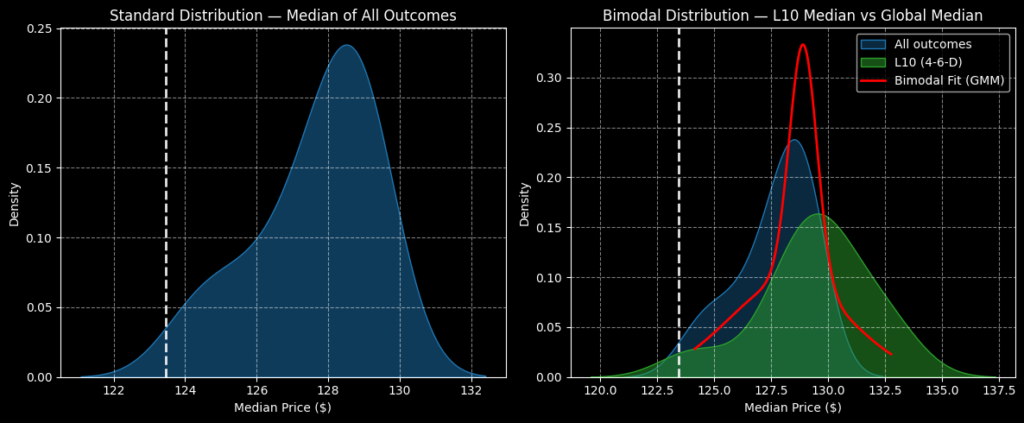
In the case of DELL stock, its forward 10-week returns typically would land between $120 and $132 (assuming an anchor price of $123.45). Further, price clustering would likely be predominant at around $128.30.
However, the current quantitative signal is structured as a 4-6-D sequence; that is, in the past 10 weeks, DELL stock printed only four up weeks, leading to an overall downward slope. Under this setup, the forward 10-week returns shift positively, from $120 to $137.50. Price clustering would likely occur just shy of $130.
For bullish options traders, the $130 level represents an obvious upside target. However, where it gets interesting is that probability decay after $130 occurs more gradually than what you would normally experience from DELL stock.
Essentially, the fat tail on the reward side is thicker — and that leads to some interesting strategies.
Two Wagers To Consider
With the above market intelligence, there are two intriguing ideas to consider. The obvious play is the 125/130 bull call spread expiring Feb. 20, 2026. This trade requires DELL stock to rise through the second-leg strike ($130) at expiration to receive the maximum payout of over 122%. Fundamentally, it’s an attractive idea because probability density drops off sharply beyond $130.

Still, for those who want to be extra ambitious, the 130/135 bull spread, also expiring Feb. 20 is perhaps the most tempting idea. Here, the maximum payout stands at over 170% if DELL stock triggers the second-leg strike at expiration. But if probability density is so low at $135, why would this trade be worth consideration?
Primarily, it has to do with the magnitude of decay. Between $130 and $132.50, probability density drops by 48.72%. From $132.50 to $135, density drops by 82.22%. In other words, probability decay becomes much more severe in the existential sense after $135, not after $130.
Plus, the aggressive 130/135 spread features a breakeven price of $131.85. This trade allows the speculator to anchor themselves at a relatively safe place in the assumed probabilistic mass while still maximizing realistic upside return potential. As such, these speculators would be limiting opportunity cost, which is an important part of the options game.
The opinions and views expressed in this content are those of the individual author and do not necessarily reflect the views of Benzinga. Benzinga is not responsible for the accuracy or reliability of any information provided herein. This content is for informational purposes only and should not be misconstrued as investment advice or a recommendation to buy or sell any security. Readers are asked not to rely on the opinions or information herein, and encouraged to do their own due diligence before making investing decisions.
Read More:
Image: Shutterstock