One of the most actively traded securities on Tuesday, SoFi Technologies Inc (NASDAQ:SOFI) earned this distinction dubiously, with its security falling about 9%. Adding to the perplexing development is that there doesn’t seem to be a distinct catalyst for the implosion. Possibly, SOFI stock is responding to concerns associated with excessive valuations, along with weakness in the cryptocurrency sector. Still, the red ink may be hiding a contrarian opportunity.
Fundamentally, experts may point to the “rich” multiples that SOFI stock has attracted. Currently, SOFI trades for over 49-times forward earnings and almost 11-times trailing-year sales. To be sure, valuation ratios are not universal truth claims. When SoFi is labeled as “overvalued” or “priced for perfection,” you should keep in mind that this assertion is relative to a subjective framework.
In other words, if you change the framework, the definition of value would also change as well. However, it must be acknowledged that human emotions play into how an enterprise is perceived — and that perception can alter reality, a phenomenon known as reflexivity. So, if SOFI stock appears richly priced to enough people, that descriptor could end up being the defining label.
On a more tangible note, lingering crypto weakness could also be weighing the fintech specialist down. Sure, volatility in the blockchain ecosystem is not a new development. However, SoFi’s crypto service is a solid business for the brand. Anything that negatively disrupts that business — including extended bearish cycles — is liable to hurt SOFI stock.
Still, one point to hold onto is that reflexivity can work in either direction. While SOFI stock may have appeared overvalued, it’s also possible that — especially with today’s fallout — traders may soon perceive a potential discount over the horizon.
SOFI Stock May Be Structured For A Rebound
As a rule of thumb, any time you place a trade in the market — especially in the options arena — you should assume that you’re trading at a disadvantage. That’s because you’re downstream of pretty much everything, from transaction speed to data flow to even expert opinion. By the time critical information gets to you, it has probably gone through several other entities.
However, the one advantage that retail traders have over the Wall Street machinery is analytical flexibility. Specifically, market makers more or less must price risk monotonically, which means that risk rises in proportion to distance away from the spot price. To use a sports analogy, making a layup is easier than sinking a three-pointer, primarily due to the variance in distance to the basket.
However, in certain game situations, the route to the layup may be heavily defended. Under these scenarios, the more probabilistically prudent move is to pass the ball to the open player standing outside the arc. While the subsequent shot attempt will be more difficult on paper, in context, it’s an easier effort.
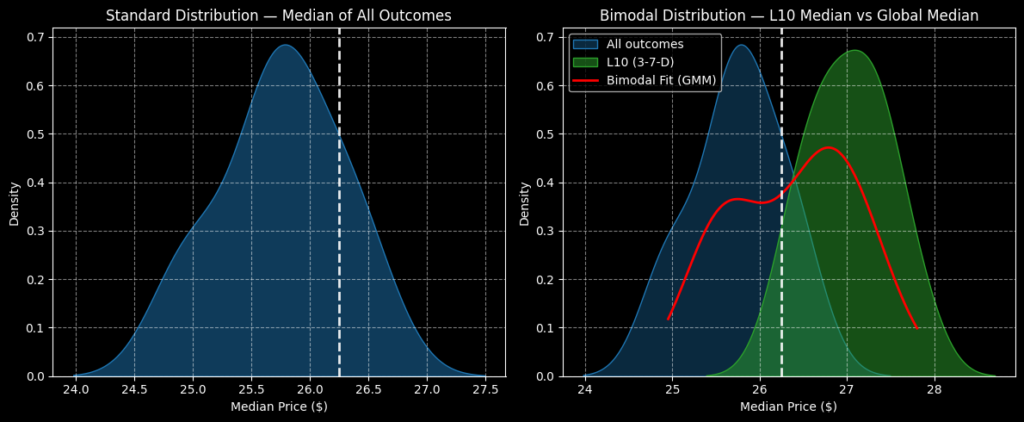
Up until Tuesday’s close, SOFI stock had printed only three up weeks in the last 10 weeks, leading to a downward slope. Ordinarily, such a circumstance would be considered risky for long-side traders as the bears would appear to have control. However, we know through past analogs of this 3-7-D (three up, seven down, downward trend) sequence that the forward 10 weeks generally tend to resolve upward.
Looking ahead, outcomes tied to the 3-7-D sequence typically land between $25.50 and $28.50 (assuming a spot price of $26.25). Predominantly, probability density would likely peak at around $27.10, marking an ideal upside target. However, there might be a case for pushing the needle a bit further.
Risk Topography Reveals Further Insight
To better understand how we can apply the insights above, we can look at risk topography, a three-dimensional view of demand structure. Risk topography encompasses expected (terminal) price, probability density and population occurrence. Essentially, this tool answers three common questions that traders ask: how much, how likely and how frequently?

Regarding SOFI stock, we’re aware of how much (in terms of expected price distribution) and how likely (height of probability mass). With risk topography, we can answer the frequency question. Between $27 and $28, significant activity is expected to materialize over the course of the next 10 weeks.
As stated earlier, the terminal outcome would likely target $27.10. However, the equities market is incredibly fluid and the heightened anticipated activity between $27 and $28 lends credence to the idea that SOFI stock could terminate near the upper boundary.
With that in mind, I’m focused on the 27/28 bull call spread expiring Feb. 20, 2026. This trade puts $46 at risk for the chance to make a maximum profit of $54, or a max payout of over 117%. Breakeven comes in at $27.46, which is near peak probability density.
An important point about the above breakeven price is that, under monotonic risk models such as Black-Scholes, options trades with a lower breakeven price of $26.70 feature a higher probability of success, which makes sense. However, under the non-monotonic model that I’m using, the relative risk of $26.70 and $27.46 is about the same.
In other words, if there’s no penalty in relative risk, I’m rationally inclined to take the wager with the greater holistic reward. That’s why I’m targeting the 27/28 call spread over other propositions.
Image: Shutterstock